Welcome to the second article in this series discussing the best software for creating crochet charts that you can add to your crochet patterns. Read more about this series of articles here.
Last time we discussed Stitch Fiddle and what that online software is good for, and today we’re talking about another piece of free software, Crochet Charts from Stitchworks.
We’ll explore the experience of working with it (employing useful screenshots from the actual application) and then some pros and cons of this software.
Did you know I also offer charting services for designers? If you don’t want to spend the time and the money to learn how to make your own charts, you can also hire me.
Here’s my full portfolio of services for drawing crochet charts and schematics for crochet patterns:
A bit about Crochet Charts from Stitchworks
Much more advanced than Stitch Fiddle, Crochet Charts has sadly been left in the state it was when the developers stopped working on it in 2015.
It is a standalone, free and open-source application that you can install on your PC if your operating system is Windows or Linux (sorry MacOS folks, no Crochet Charts for you, but then you don’t get free software in general…).
Still, it’s much better at handling actual crochet stitches than Stitch Fiddle.
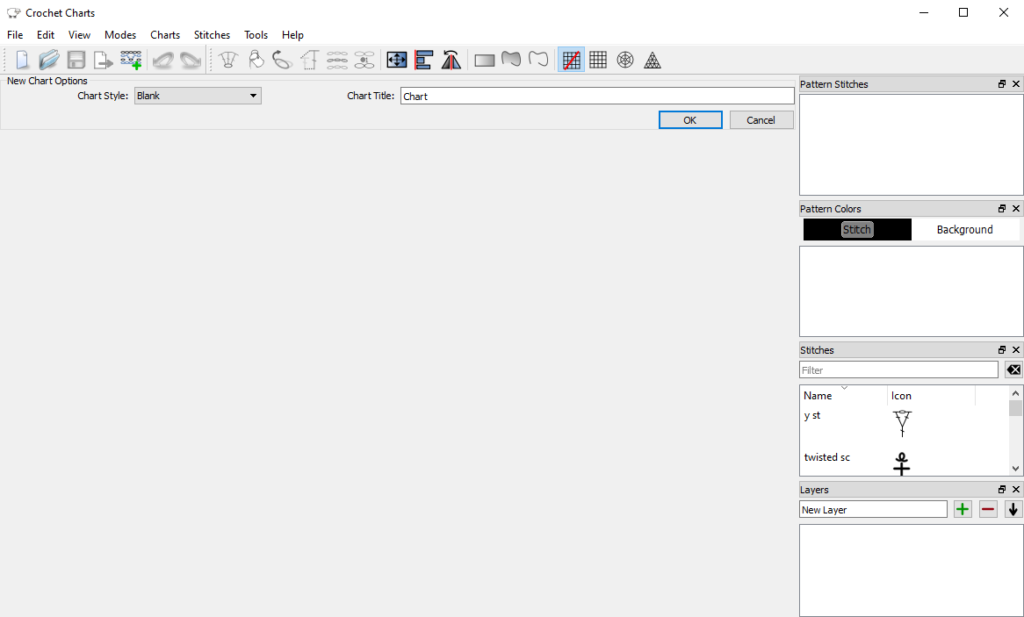
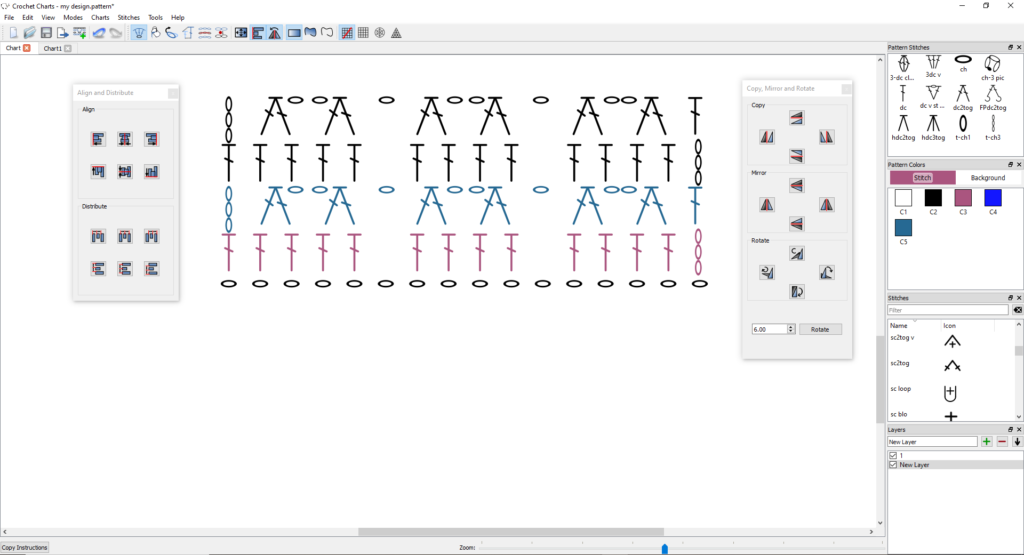
Features of Crochet Charts
This software is not really made for color charts, as its main elements are the actual stitches.
Which is why you’ll love that it has all that is missing in Stitch Fiddle (even though development has been discontinued for over five years!): grouping, quick aligning, rotating, even layers.
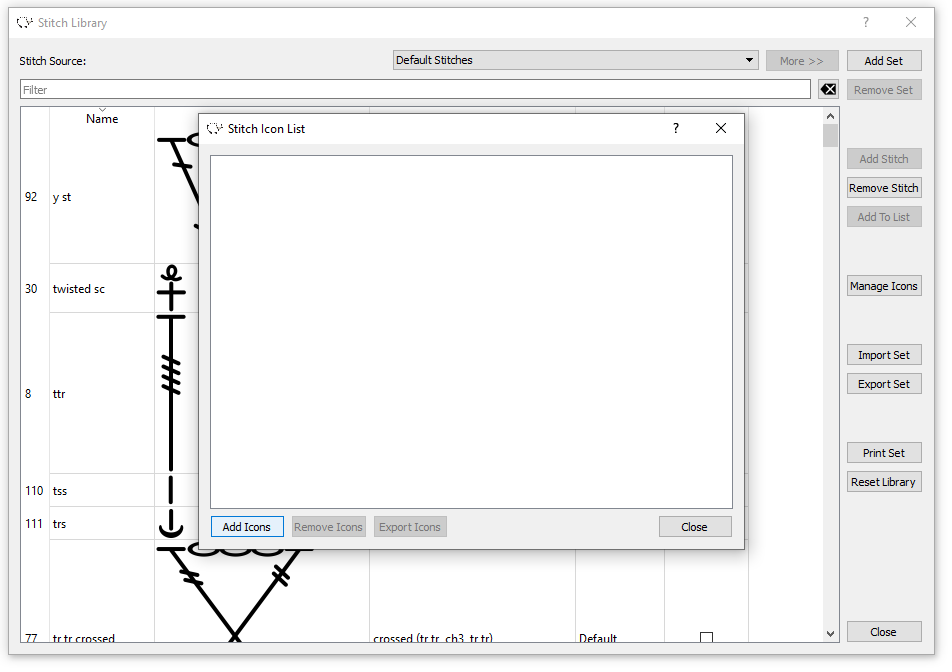
Adding custom stitches
You can even add your own stitches in the stitch library, by creating them in another software, exporting them in one of the supported formats (.png is my suggestion) and importing them.
You need to first open the stitch library (Tools/Stitch Library), then click on Manage Icons and there you’ll be able to import your own icons.
It’s a bit difficult, but at least you have the option!
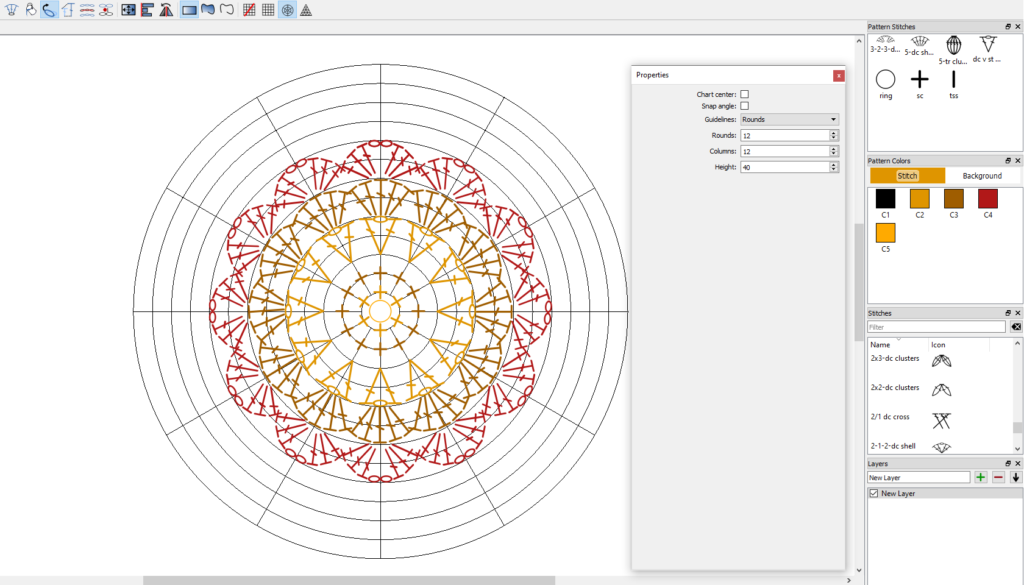
Grids and editing their properties
You have grids, including a radial or a triangular grid, which you can edit by pressing the “P” key (yes, I know, it’s not easy to find) and changing the values there, as the original radial grid comes with 15 sections.
You can edit the properties of the grid (number of rows, number of divisions, height of rows) in the Properties panel, found under View/Show properties.
Editing stitch properties
The same properties panel works for stitches as well, so you can change the colors of the stitches, their dimensions (crudely), angle.
You’re even able to change the stitches themselves if you’re not happy with how they look in your chart.
If you have a certain color in mind for each row, it’s better to prepare that color beforehand, then to place the already colored stitches where you want them.
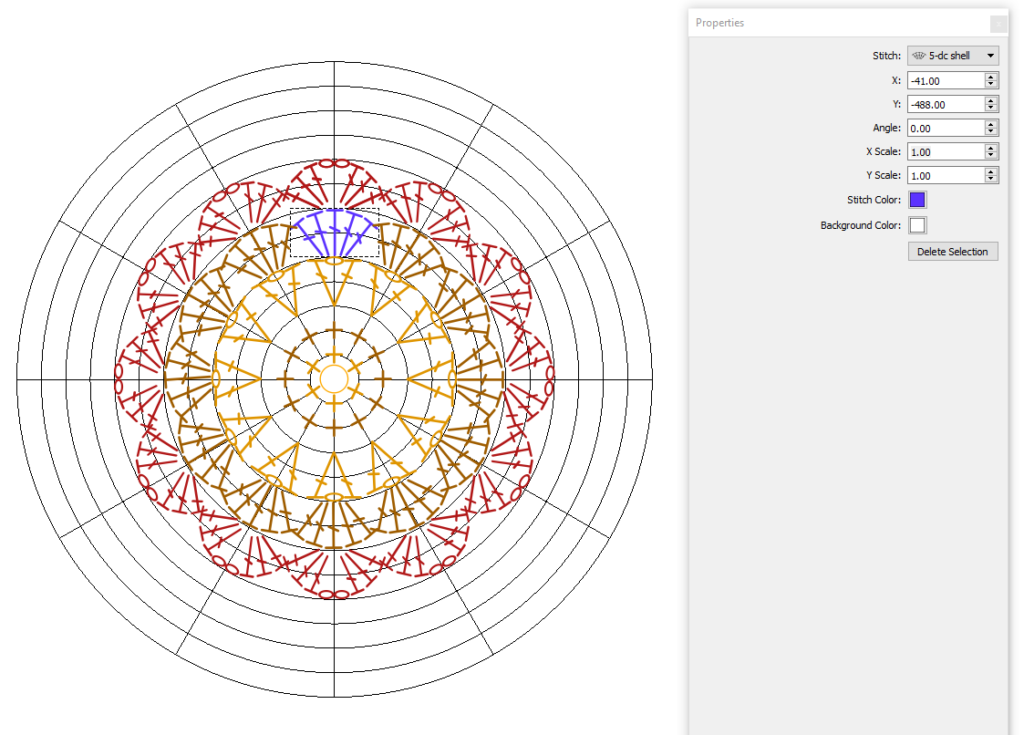
Placing stitches on the radial grid
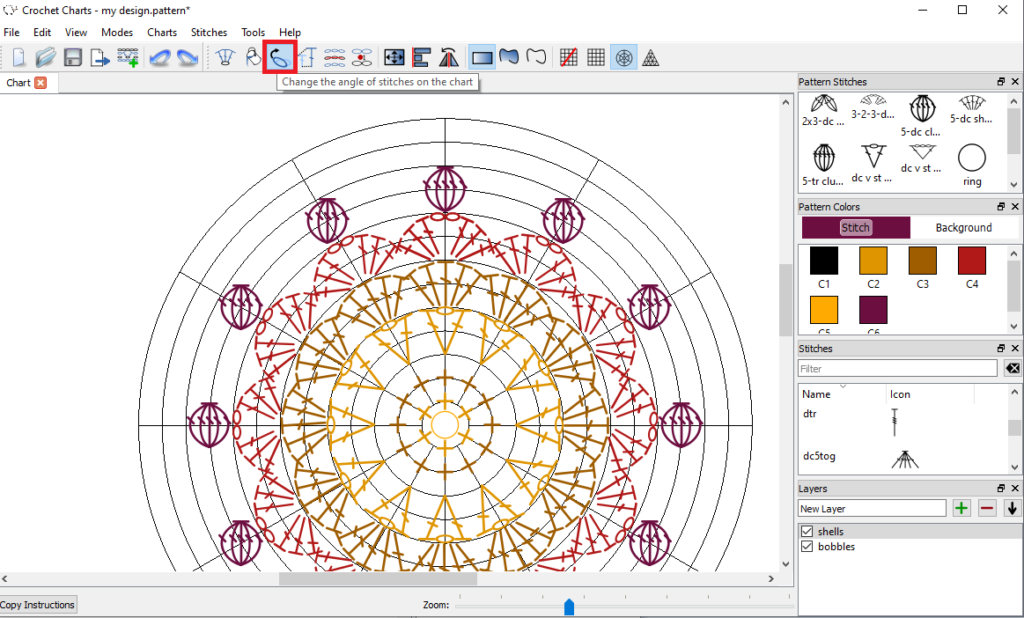
When you place your stitches on the grid, they will be all oriented in the same direction (standing up, see image below).
Don’t worry about it, as you’ll be able to rotate them into place using the aptly named Change the angle of stitches on the chart button(I guess “rotate” was taken?).
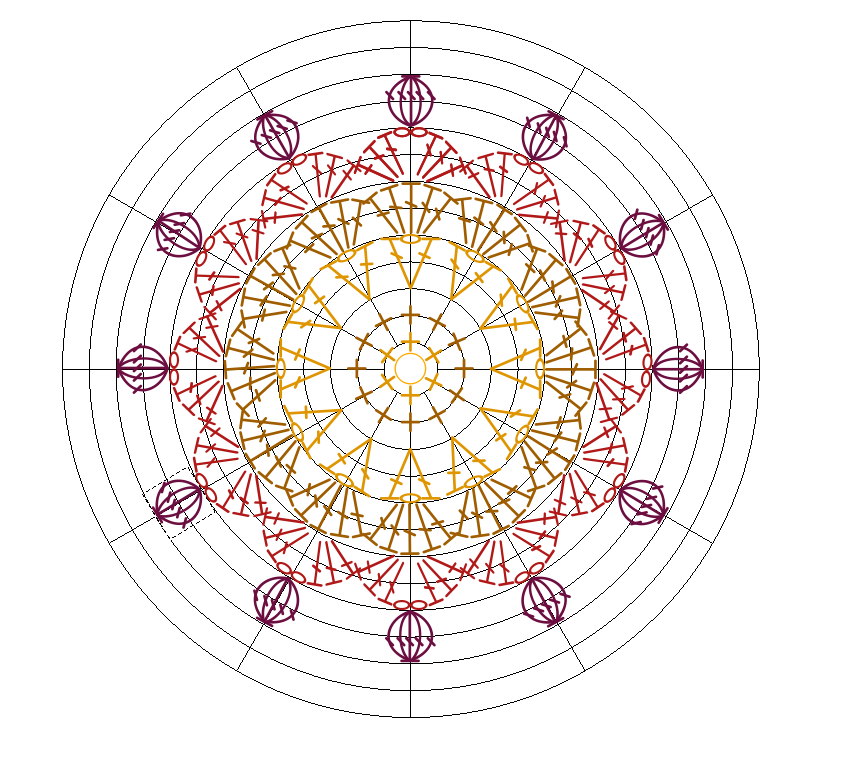
Click on the photos to see them full-sized.
General issues
You’ll encounter some problems when trying to add more stitches on the grid.
You might be surprised that your stitches will all stick to the same points at the intersections in the grid. Ugh.
That’s not something you can get rid of unless you turn off the grid (in which case you can’t align anything to the grid any more…).
Also, if you try to place a stitch close to another stitch on a different row, the other stitch will turn into your working stitch, ruining your hard work.
To bypass this, I recommend using different layers for each row.
Just rename the layers with “Row 1”, “Row 2” and so on, so you don’t get confused (I was lazy in this example and only made a new row for the bobbles).
Exporting
When you’re done with your chart, you can save it as a .pattern file, so you’ll be able to edit it later.
Then you can export it under File/Export into a few file formats. I recommend .png with a decent resolution (I normally go for 150 dpi for my patterns), so when you add this chart to your pattern, it will have decent quality.
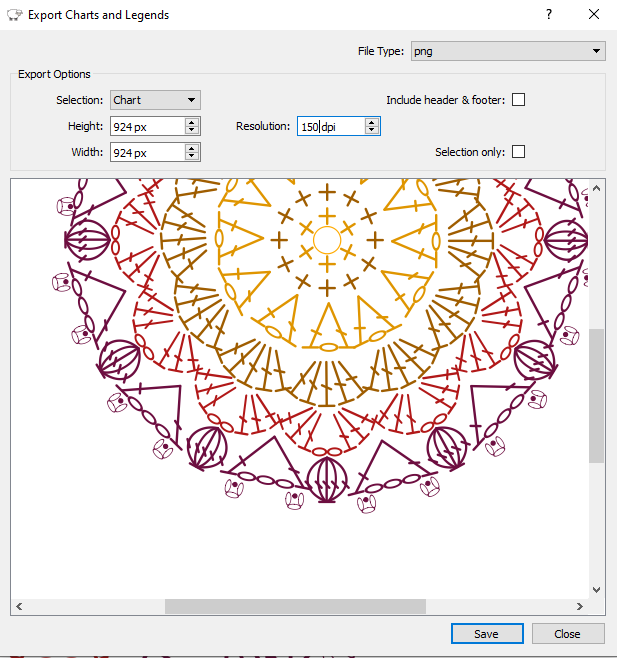
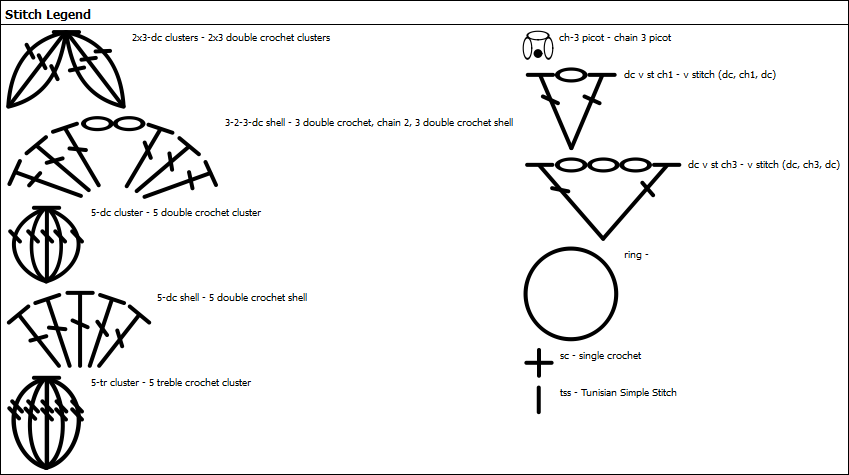
Chart legend
You can also export the legend, but it’s a bit messed up because it also shows stitches that are not in the chart at all.
There’s no option to remove them when exporting, unfortunately.
There’s also no option to reorder or rename anything in this ugly legend.
Final thoughts
There may be more aspects we could explore, but there were the ones I found essential when playing around with the software.
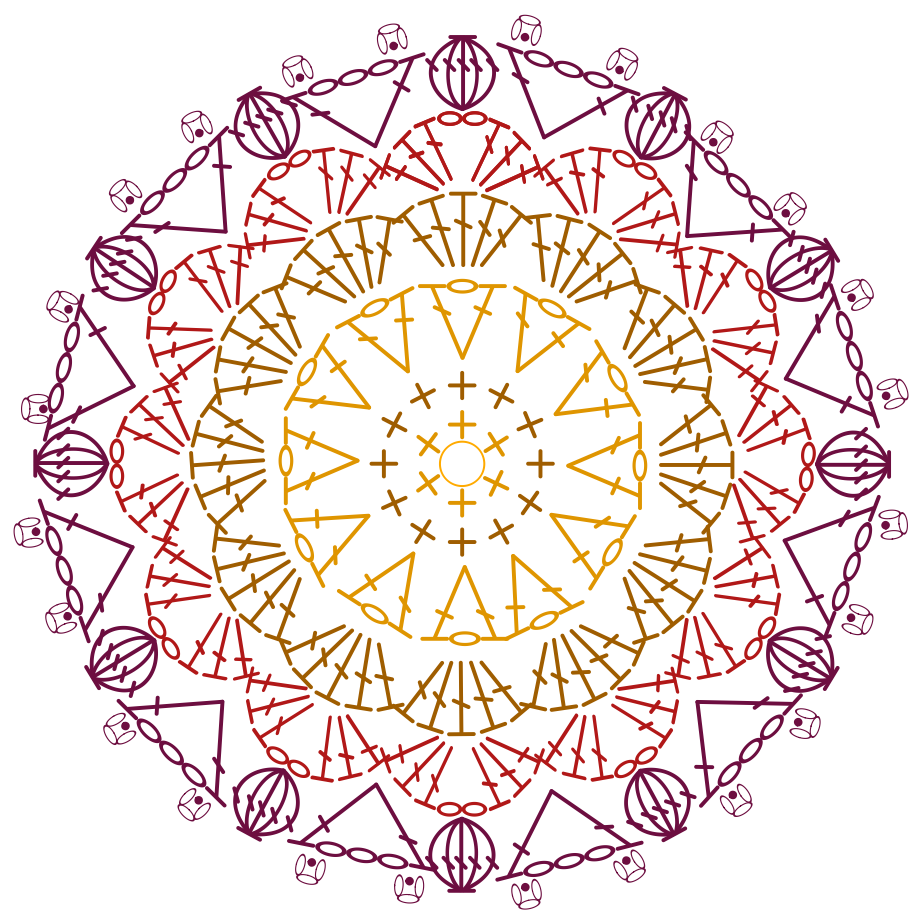
Here’s the finished chart, if you want to try it out and make a mandala from a random design example. There is no beginning and no end, just like in a true mandala.
Just kidding, but it would have taken twice as long to add starting chains to each row as it took to cobble this up using existing stitches.
Pros and cons of using Inkscape to draw crochet charts
Pros:
- It’s free and open source, so if you have any programmer friends who’d like to help bring it into this decade, here’s the Github repository they can start from;
- It has a lot that’s missing in Stitch Fiddle: grouping, grids, aligning, layers, adding custom stitches, changing colors of individual stitches;
- It has a large stitch library with lots of stitches.
- There’s a separate panel for the stitches you used in your project, so you can find them easily.
Cons:
- You can’t really find stitches easily because they are not separated into categories, nor are they ordered alphabetically when you open the application (you need to order them by name again to get a decent list that is ordered alphabetically);
- Adding new stitches is counter-intuitive and there’s no template for you to follow when making up your custom stitches in other applications;
- It’s still a little basic with regards to creating complex designs;
- There’s no official guide to using it (there was something at some point, apparently, but I can’t find it anywhere), so some of the features are not easy to find (for example, Properties is under View, not Edit);
- The stitches replace each other, even if you don’t click on another stitch (use layers to bypass this) and they only stick to specific spots on the grids, not allowing you to place stitches over the whole row.
There’s a steep learning curve to get used to the commands and way the software works, but that’s valid for most graphic design applications.
Wrapping up
If you plan on creating charts with symbols for simple patterns, but don’t want to draw your own, especially if you make only rectangular designs, I can wholeheartedly recommend installing and using Crochet Charts.
It’s much more robust than Stitch Fiddle and, once you get the hang of the software, it will be much easier for you to upgrade to more complex graphic design software, as you’ll already be familiar with some of the tools that make your life so much easier when creating a chart.
Did you know I also offer charting services for designers? If you don’t want to spend the time and the money to learn how to make your own charts, you can also hire me.
Here’s my full portfolio of services for drawing crochet charts and schematics for crochet patterns:
Here are other blog articles about the design process.
Project diary – Calliandra round yoke top
Frilly summer top in Tunisian crochet – project diary
Slate etching Tunisian crochet sweater – project diary
Sempervivum shawl – project diary
How to remove sizes quickly in crochet or knitting patterns
Body measurements for garment design – survey results April 2023
Size inclusive body measurements for crochet garment design
Macaw wings shawl design process
Why you should make your digital products more accessible and how
Why and how to find your niche as a crochet designer
I hope you enjoyed this article and that I’ll see you around, when I publish the other articles on this topic.
Hugs,
Andrea
If you want to keep up with news only for designers, with articles just like this one, sign up here.
Otherwise, you can sign up to the general list and get a free pattern.
If you sign up to the general list, you’ll also get updates for designers.



Hi, there is a correction.. crochet charts is available for Mac users. It is available through Ravelry and other sources. Not sure why it is not listed on his website, maybe because a lot of Mac users can access Linux.
Hi Linda. I only wrote based on what I saw there is available to download.
There are still only 2 links on their website, one for Windows, one for Linux.
How do you get the software if you use Mac? Thanks!
it’s on their ravelry