In this article, we’re exploring whether it’s more suitable for you to use Adobe Illustrator for crochet charts and what makes it so nice for this purpose. This article is part of a series for crochet designers. Read more here.
Contents
A bit about Adobe Illustrator
You’ve definitely heard of Adobe Illustrator (AI from now on in this article) from one source or another.
At least you know about Adobe Reader, since it has been touted and recommended endlessly as the “only” pdf reader for more than a decade (it’s not the only one and not even the best – I wholeheartedly recommend Foxit Reader, which is also free, but much more user friendly, especially if you’re used to the ribbons in the Microsoft Office suite and need more than the ability to just read a pdf file).
AI is part of a suite of “productivity software” offered by Adobe. You’ve also probably heard of:
- Photoshop (here’s a free and more user-friendly alternative, GIMP),
- Lightroom (I don’t have any free alternatives for this one, sorry),
- Premiere Pro (for video editing),
- a bunch of other applications used in the design and creative market for anything from photo editing and retouching, to video editing and 3D rendering, to sound editing and so on.
You can get AI for a 7 day free trial and I think it’s a good idea if you want to find out whether these apps are a good match for your working style and if they are necessary for you.
Since AI is part of this productivity suite called Creative Cloud (CC), you can only use it if you buy a license (outsize of the 7 days that are free).
Right now, as I’m writing this, a monthly license for AI alone costs 24 euros with tax or about 21 USD without tax, or you can get a license for the whole package of apps for 48 euros or about 53 USD.
It might be worth it to you to get AI from the beginning of your design journey, especially if you already know how to use the app, but I’d start with Inkscape if you can’t afford to invest into this software just yet.
Did you know I also offer charting services for designers? If you don’t want to spend the time and the money to learn how to make your own charts, you can also hire me.
Here’s my full portfolio of services for drawing crochet charts and schematics for crochet patterns:
Using Adobe Illustrator
Since this is another application for vector graphics, the controls are very similar to those of Inkscape, which I discussed in detail in another article here.
The basics are the same, you have most tools in both applications, there might be more specific tools in one or the other, but you have exactly the same kind of flow when using either application.
The differences come mostly in the use of keyboard shortcuts, which are the life and soul of AI. You also have shortcuts in Inkscape, but to me they seem less intuitive (but that may be, again, just because I’m already used to some of them).
My most used keyboard shortcuts are:
- panning and zooming – holding down Ctrl or Alt zooms in or out or moves the canvas side to side, while scrolling;
- panning with the space bar – holding down space bar and clicking on the canvas to drag it around;
- copying – pressing down Alt while dragging a selection with the mouse makes a floating copy that you can place anywhere;
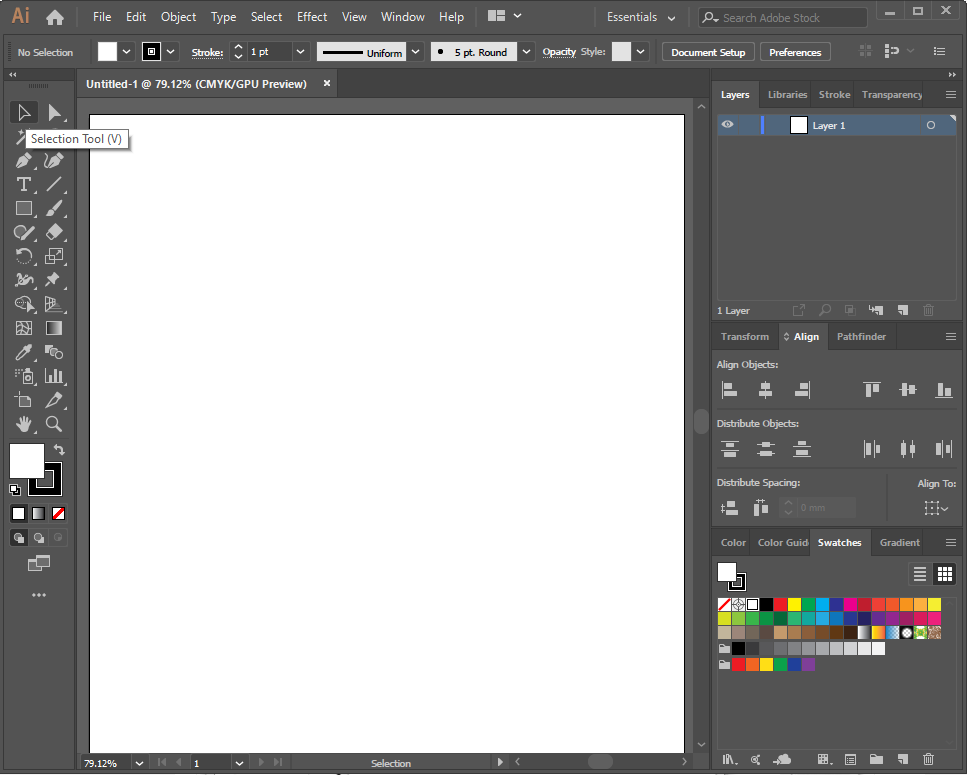
- selection tool – pressing V to turn the cursor into the selection tool;
- direct selection tool – pressing A to turn the cursor into the tool that allows you to edit points and paths;
- transform again – pressing Ctrl and D at the same time will make the new selection do the previous transformation – move, reflect, rotate etc.
You’ll find all the shortcuts here, but beware, they’re a lot and are really confusing if you don’t have examples of use for each.
In my list, they are not that many because you don’t need that much to create charts in AI (there are many more tools and shortcuts, but unless you’re a graphic designer working full time in this field you don’t really need them).
The Transform tool
Another aspect that I really appreciate in AI is the transform tool, which has multiple subsections: move, rotate, reflect, scale and shear.
They all have their own keyboard shortcuts, but I generally just use the mouse to select them because I don’t use them that often.
The best thing about the transform tool is that it has a preview and a copy option, so that you can see exactly how your transformed piece will look and you can make a copy without affecting the original.
Let’s see this in practice.
Let’s say you want to create a pattern that’s based on 12 30° wedges. You only create one wedge, then rotate/copy it at a 30° angle, and then Ctrl+D until you have a full circle.
For this purpose, I’ve created this simple 12-spoke grid using the ellipse tool and the line tool.
You can set the size of each circle by clicking with the ellipse tool in an empty spot and using the dialog that appears to make circles that are larger and larger, with the same difference between them, for example 1 cm.
Then you select all the circles and align them to the center, horizontally and vertically, and group them.
Then draw one vertical line from the center of the circles.
Rotate the line at 30 degree angles and make copies of it, using the Crtl+D shortcut.
Afterwards, select everything and use the pathfinder (the panel on the right, below layers, above swatches) and click the Divide button to create the grid.
Lock this grid and it’s now ready for drawing.
If you want to download this grid for your own use, you can find it here (you need to unzip it before opening). It’s only 8 rows, though, so for more rows you’ll need to make your own using the steps above.
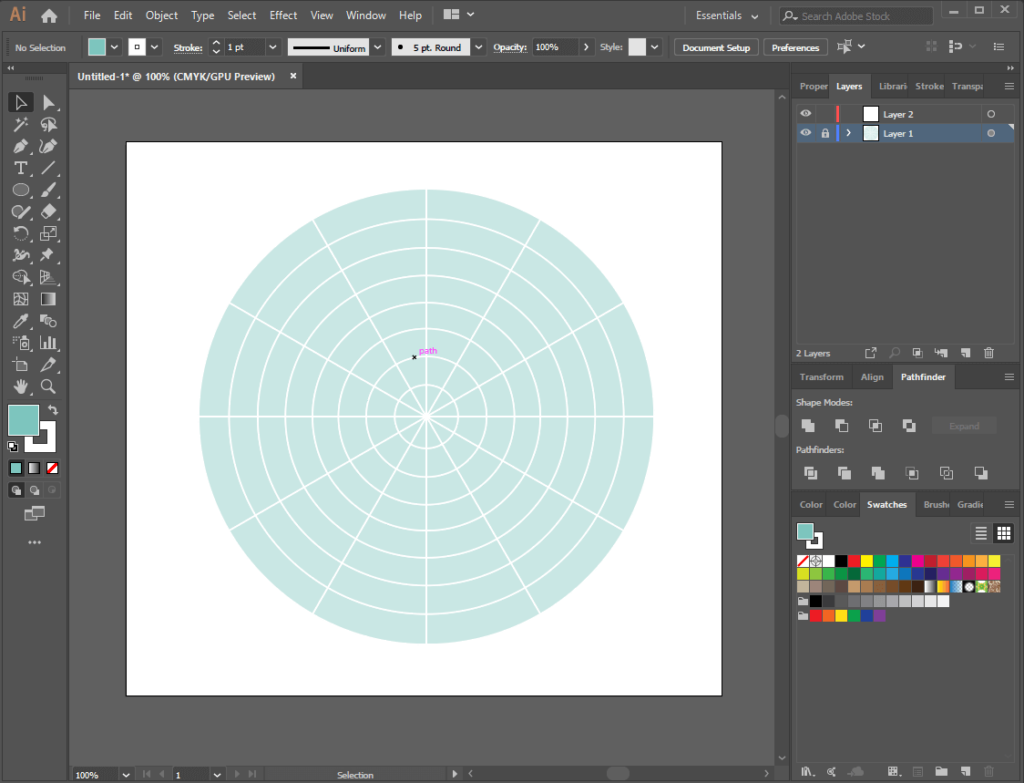
Once you have the grid, you can delete 11 of the spokes and concentrate on only one, building up your stitches over it.
Or leave them on and work on multiple spokes, if you have interactions between the different sections, for example.
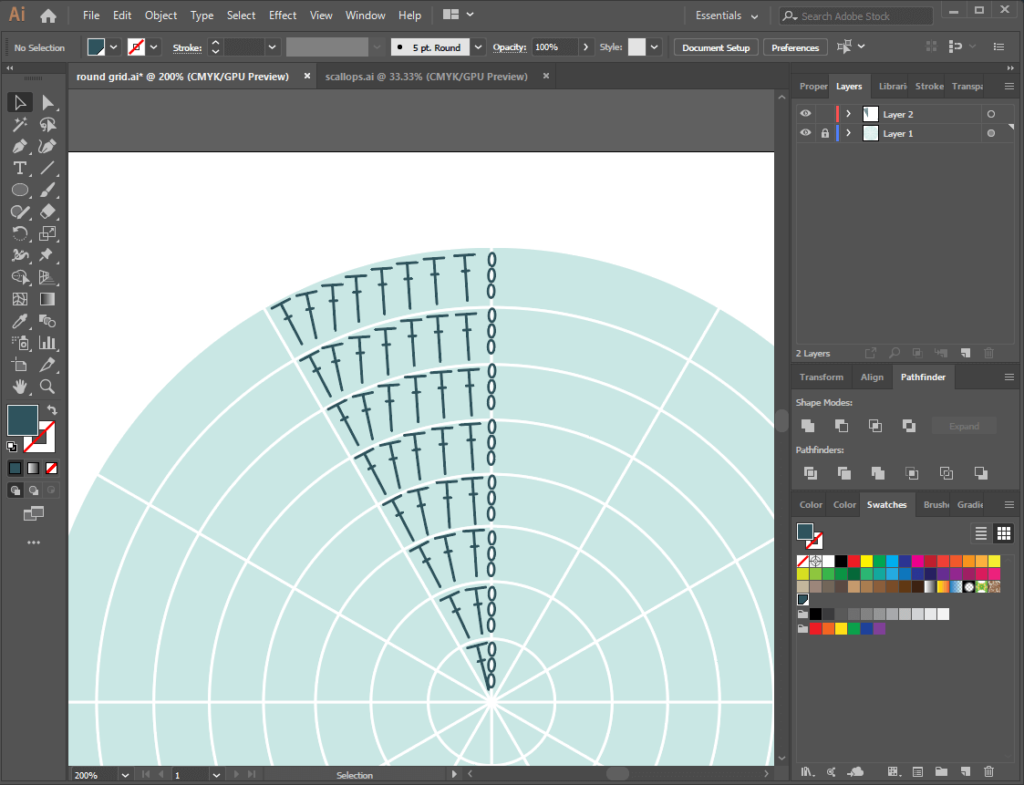
When you’re satisfied with what you have, like in the very basic example above, you select your stitches and start duplicating.
Select your stitches, then select the rotate tool and select the center of your grid by pressing Alt key on your keyboard and clicking at the same time in the center of the grid (turn on Smart Guides under View or press Ctrl + U if you want to select the exact center of the grid).
Then the Rotate dialog appears and you can set your angle.
Click the copy button, then you’ll have your first copy.
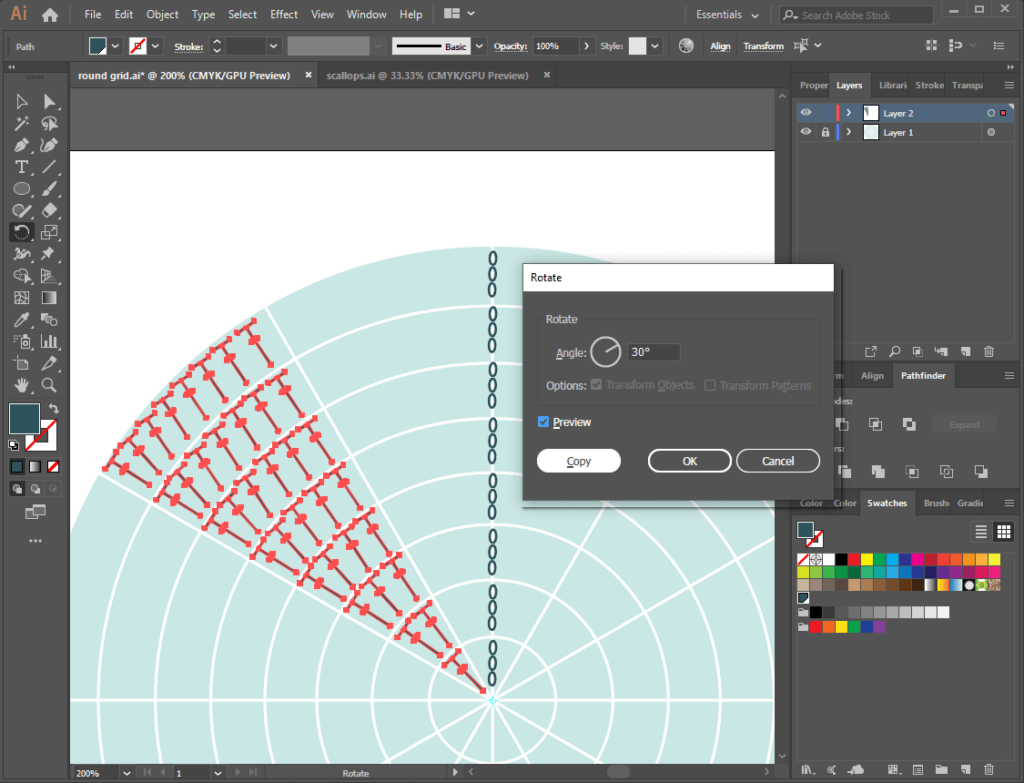
After making the first copy, you just press Ctrl+D and the software repeats your action until you fill the circle (or stop wherever you want, for your specific shape).
This way, it’s really easy to create symmetrical patterns, any rounded pattern, any circle or half-circle with repeating stitches across each row.
That’s a really neat and quick way to decrease the amount of work you need to do while creating charts.
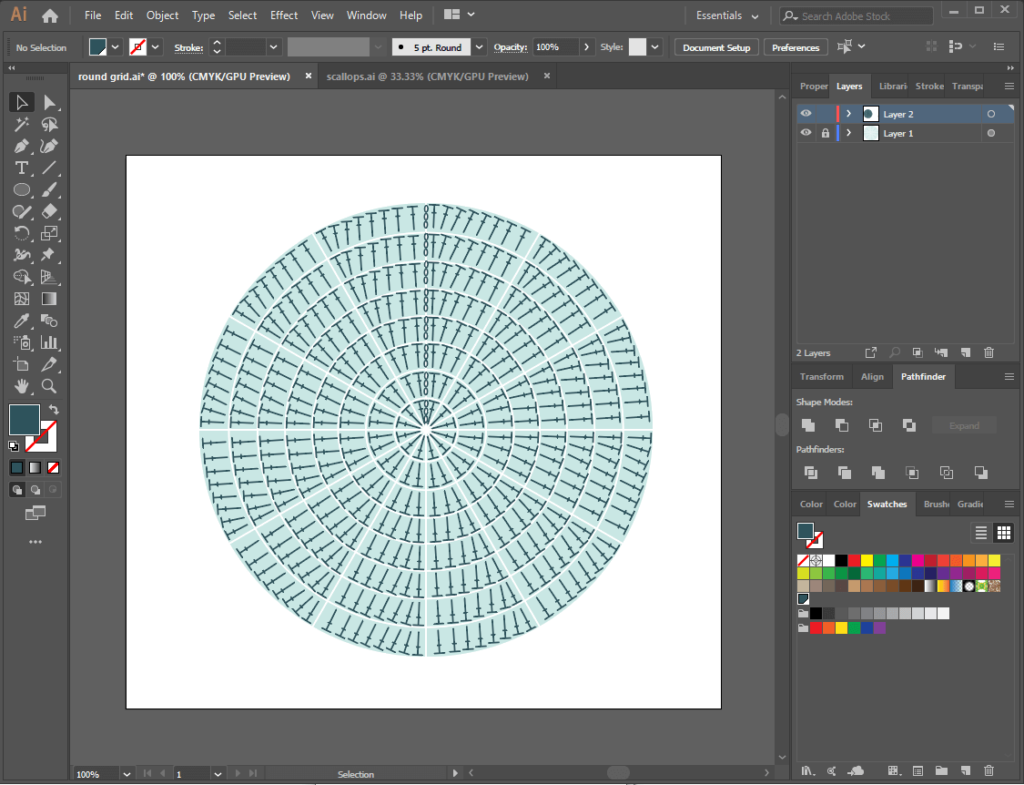
After that, all is left to do is tweak your resulting chart – add beginning chains or row numbers, fix alignment issues, change colors.
You only need to make these changes in one section, since you can just duplicate that one again and again, as many times as you need, until you get a very nice chart.
This is also valid for other types of charts. You can use the Move and Reflect and Rotate tools to reduce your work so much.
AI seems like a breeze to use, but the same steps are necessary to create a graph in AI as in Inkscape: first draw your stitches, then assemble them, then copy/move them around.
You can use layers and add your sketch in the background in a locked layer, just like the grid in the example above. Or make each row on its own layer.
You can change everything about your stitches and your graphs at any time, so that’s at least a bit of a relief.
Now let’s see the pros and cons of AI versus Inkscape and the other applications we’ve explored here.
Pros and cons of using Adobe Illustrator for crochet charts
Pros:
- Lots of tutorials available – there are many more tutorials, especially video tutorials, for AI; don’t ask me why, maybe it’s because there’s a lot of people who use it professionally and like to share their wisdom, as opposed to the fewer who use Inkscape;
- Easy to navigate and start making things right away;
- Friendly shortcuts and some very intuitive tools;
- Layers – you can add your sketch as a background layer and work on top of it or add multiple layers of stitches;
- Custom stitches – build your own stitches with as many details as you want;
- Stitches in your own style – you can customize your stitches in any way you like, including thickness, roundedness, angles, colors;
- You can also create other illustrations for your pattern, such as: pattern pieces, specific shapes with measurements, illustrations of your pattern while laid flat or anything else you can think of.
Cons:
- Expensive – at over 300-400 euros per year per license (including taxes), you better be making some serious money from those patterns that you make with this software;
- Only available for Windows and MacOS users – but hey, if you use Linux then you’ll love Inkscape;
- Steep learning curve, especially as you learn a workflow that’s suitable for your own style and until you get used to the navigation and the shortcuts (learn them early on, it’s worth it);
- Doesn’t have all the different alignment and distribution tools as Inkscape (I know I keep insisting on this aspect, but it’s super important in this line of work).
If I can think of any more pros and cons or if you can suggest some, I’ll add them to the list.
Wrapping up
I hope by now you have a good idea of what it means to use either of these applications, with their strengths and weaknesses.
It’s a lot to go through, but it’s a lot less effort to read everything on this page, make an informed decision and learn one software well, than to try this and that until you run out of patience and time and get angry at everything because nothing makes sense, then settle on something you’re not happy with, but works “for now”.
As for my recommendation, if you’re a complete beginner in the art of creating crochet charts, I recommend starting with Crochet Charts, that will be a gentler introduction.
You’ll get a feel for the stitches and when you’re excited enough to start making your own, I’d set aside some time to learn Inkscape or I’d set aside some time and some money to learn Illustrator.
Either one is a good choice for creating charts, except one costs more than the other.
As for colored charts, I recommend you stick with Stitch Fiddle, as it was made exactly for that and it’s so much easier than making colored grids in Inkscape or Illustrator (which is why I didn’t even bring it up in these articles, even if it is possible).
Stitch Fiddle may not be very strong in other aspects, but it’s great at making charts for graphgans or C2C blankets or anything else made up of colored pixels.
You can definitely create this kind of chart in Inkscape or Illustrator, but why bother setting it all up, when you have such a powerful and specific tool already?
Did you know I also offer charting services for designers? If you don’t want to spend the time and the money to learn how to make your own charts, you can also hire me.
Here’s my full portfolio of services for drawing crochet charts and schematics for crochet patterns:
I really hope this helps you in making the right choice for yourself and if you have any questions about making charts, I’m happy to help from my limited experience.
If you want to read about other pieces of software that I’ve reviewed with the idea of crochet design in mind, here’s the series of blog posts dedicated to this topic, among other topics relevant to crochet designers:
Project diary – Calliandra round yoke top
Frilly summer top in Tunisian crochet – project diary
Slate etching Tunisian crochet sweater – project diary
Sempervivum shawl – project diary
How to remove sizes quickly in crochet or knitting patterns
Body measurements for garment design – survey results April 2023
If you’re interested in more articles regarding crochet design, here are some relating to measurements:
- Size inclusive body measurements for crochet garment design
- How to measure yourself for fitting handmade garments – 19 points
- Body measurements for garment design – survey results April 2023
You can also use the guide for customizing the fit of your garments to make your crochet designs more size and shape inclusive. You can get that when you subscribe to my email updates.
Also, if you have any tips for me or other designers, please write them down, either here in a comment, or on your own blog and let me know, so I can link to your work.
We are all in this together and we should help each other grow.
Happy hooking!
Andrea

